Comparison of Performance and Pollution Emission of Engine
Fueled with Gasoline Ethanol Blended Fuels and Biogas
Bui Van Ga, Tran Van Nam, Nguyen Van Đong, Bui Van Tan
University of Science and Technology, The University of Danang
Journal of Science and Technology 112 (2016), pp. 93-99
Abstract
Indicated cycle work of Daewoo engine fueled with E15 at speed 5000rpm increases 5.3% as engine compression ratio increased from 9.5 to 10.3. However the indicated cycle work decreased by 20% when the engine speed increases from 2000rpm to 5000rpm with a given compression ratio. If advance ignition timming is kept constant, the engine cycle work slightly decreases while rising ethanol concentration in gasoline. Indicated engine cycle work decreases about 3% as fueled with E30 and decreases 17% as fueled with biogas containing 95% CH4 in comparison with gasoline case.
As a given engine speed, as engine compression ratio increased from 9.5 to 10.3, the concentration of NOx in the exhaust gas rose 7% and the concentration of CO increased 1%. As the engine speed increases from 2000rpm to 5000rpm NOx concentration in exhaust gas decreases 78.5% while the concentration of CO increased by 5%. As the engine fueled with E5 and E30, NOx in exhaust gas concentrations increase, respectively 3% and 15% while reducing the corresponding CO levels were 17% and 87% compared to gasoline. When running on biogas containing 95% CH4, NOx concentration in the exhaust gas decreased to 43% and CO concentration decreased to 39% compared to gasoline. NOx concentration decreased slightly but CO concentration is almost unchanged while reducing engine load. NOx concentration increases slightly with admission mixture temperature but decreases strongtly with exhaust gas recycled.
Keywords: Alternative Fuels, Ethanol, Biogas, Pollution Emission, Engine Performance
1. Introduction
COP21 summit on climate change organized by the United Nations in Paris has made historic decision after 20 years of negotiations. 195 countries agreed to take actions to reduce the level of gas emissions causing the greenhouse effect for the Earth’s temperature does not rise to 20C than average temperatures from 1889 to 1899 period. Increased use of renewable fuel derived from solar energy is one of the fundamental solutions to achieve COP21
Vietnam is a tropical country with nearly 80% of the population live in rural areas. Waste from agriculture and animal husbandry are very good raw material for the production of bio-fuels. Ethanol and biogas are renewable fuels that can be produced from organic substances. Their use does not increase fuel gases causing the greenhouse effect in the atmosphere.
Ethanol blended gasoline has been widely used in many countries around the world with different mixing ratio. According to the regulations of the Government of Vietnam, gasoline 5% volume ethanol (called E5) are widely used across the country from the date 1-12-2015. Ethanol is organic compound, located in the homologous series of ethyl alcohol, has a high octane number than gasoline. Ethanol can therefore be used to raise the octane of the fuel to improve the efficiency of the combustion process in internal combustion engines [1].
Mustafa Koc studied the effects of E50 and E85 ethanol blended gasoline to the engine functionality and pollution emission levels at compression ratio 10, 11 and engine speed ranges from 1500 to 5000 rpm. The results showed that when ethanol is mixed into gasoline, motor torque and fuel consumption increased, but the level of pollution emissions reduction [2]. This study also showed that ethanol blended gasoline allows increase compression ratio of engine without detonation occurs. Due to the latent heat of evaporation and burning temperature of ethanol are higher than gasoline, latency burn time of ethanol is prolonged. Therefore, to increase the efficiency of ethanol blended gasoline-powered engines we need to increase advance ignition angle of the engine as a function of ethanolcontent.Richie Daniel studied empirically the effects of advance ignition angle to performance of ethanol and gasoline engines [3]. Results showed that at a speed 1500 rpm, angle-ignition is about 7-80 for gasoline and about 220 for ethanol [3]. Phuangwongtrakul tested gasohol with different content of ethanol. Results showed that, at 5000 rpm, the largest torque achieved is with ignition angles are 300, 350 and 400 with E10, E30 and E85, respectively [4].
In this paper we study the combustionprocess and performance ofethanol blended gasoline-powered enginewithdifferent concentration of ethanol. Effects of ignition angle and the engine compression ratio are also examined and evaluated.The experiment was conducted at Engine and Automobile Testing Center, University of Science and Technology, The University of Danang.The experiment systemis equipped with AVL’s laboratory equipment. Detailed description of the engine testing system is presented in [5]. Daewoo engine A16DMS was renovated to experiment with a mixture of petrol and ethanol. Thatis a 4-stroke engine, 4 cylinders, cylinder diameter79mm, stroke81,5mm, total cylinder volume 1598cm3, compression ratio 9.5. The maximum powerof the engine withgasoline is 78kW at 5800rpm.
Experimental fuel mixture is E15whichcomposes15% ethanol and 85% RON92trade gasoline, by volume.
2. Simulation of burning process
Figure 1 presents the cylinder and the engine combustion chamber Daewoo wasmeshedto simulate with ANSYS FLUENT software. In the simulationwe used the model k-ε turbulence model and the partially premixed combustion model. Modellingand setting dynamic nets duringthe piston displacement insideengine cylinder is presented in [6]. The fuel’scomponents areadjustedand chemical thermodynamic characteristics of burning mixedare set in a map in order to access quickly during simulationof combustion in the cylinder. In the following simulation, equivalence coefficientof the mixture is selected f = 1.1, ignition angle is 250before TDC.
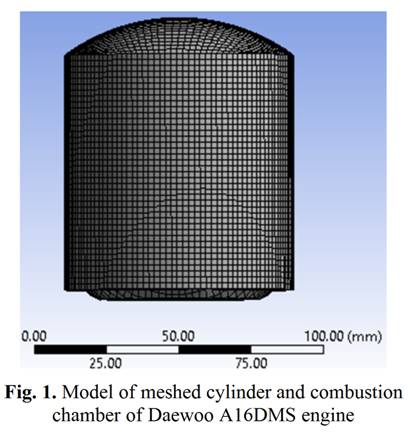

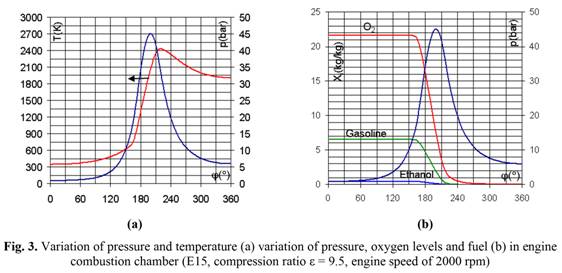
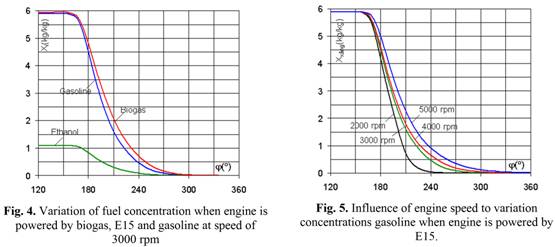
Figure 2 shows the development of burningarea on the cross section which is 8 mm from the top of the combustion chamber. On the cross section, it can be seen that flame is acircle with the radius increases with the crankshaft angle. Figure 3apresentspressureand temperaturevariationin the engine cylinder; Figure 3b presents pressure variations and concentrations of O2, gasoline and ethanol withthe crankshaft angle. At the start of burning, concentration of the substancesdecreases whiletemperature and pressure in the cylinder increases rapidly.Temperature peak is later than the peak of pressure about 200. Figure 4 presents the fuel concentration variation at speed of 3000 rpm with E15 and with biogas containing 95% CH4. This result shows that the consumption rate of CH4 is approximate gasoline consumption rate. Meanwhile ethanol consumption rate is much lower than the two aforementioned fuel types. Figure 5 presents the influenceof the engine speed to the variationofaverage gasolineconcentration in the combustion mixtureduring burning process. It can be seen thatwhen the enginespeedincreases, the rate of fuel consumption decrease.The correlation between the temperature of the gas mixture and concentrations of CO, NOx when the engine runs on E15 is presented in Figure 6a and 6b. The mass concentrations of pollutants were averaged over the entire volume of the combustion chamber.It can be seen thatafter the launch of burning process, pollutant concentrations increased rapidly with the increase in temperature and reaches a maximum value before the temperature reaches its peak. CO formation rate depends on the concentration and temperature of the fuel. MaximumCO concentration is achieved atthe high temperature and fuel concentration.
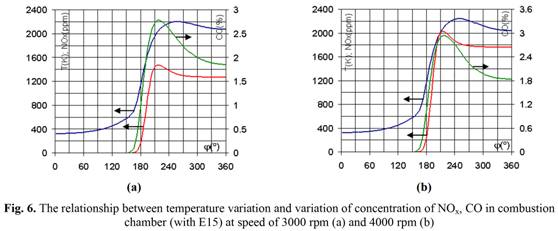
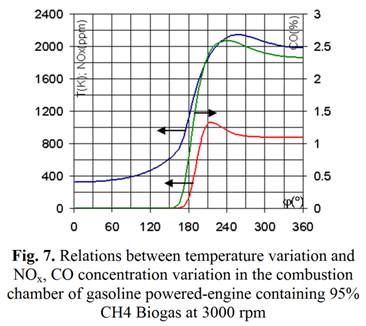
Meanwhile, the rate of formation of NOx depends on the oxygen concentration and temperature.Above results show that CO and NOx reach their peaks almost at the same position of crankshaft with different engine speeds(Figure 6a, b). For biogas fuels, peak of COconcentrationis achievedlater than one of NOx (Figure 7). After reaching the maximum value, CO and NOx oxidized with residual oxygen in the mixture and therefore their concentrations reduceduring expansion.
3. Analysis of engine performance
Figure 8a, b introduce the influence of engine speed to work diagram when engine fueled by E15 with compression ratio 9.5 and 10.3.It can be seen thatin thesameoperating conditionsindicated work of the engine decreases as the engine speed increases. This can be explained by the time for burning process decrease whenengine speedincreases. A fire in the fuel department expansion phase, reducing the fertility.A portion of the fuel burns in the expansion phasereducing the fertilityof work.When increaseengine speed from 2000 rpmto 5000 rpm with compression ratio 9.5, the indicatedcycleworkdecreases from 574J/cycle to 457J/cycle(about 20%).Similarly, with compression ratio of 10.3, the indicated cycle work decreases from 588J/cycle to 481J/cycle (about 18%) with the same level of engine speed (Figure 9). When the engine compression ratio increases from 9.5 to 10.3, the indicated cycle work increases by 2.4% at 2000 rpm and by 5.3% at 5000 rpm.
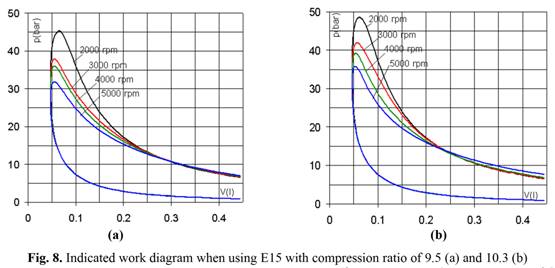
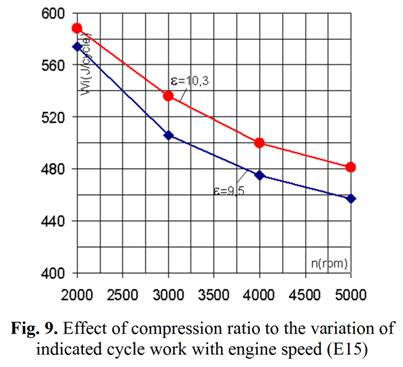
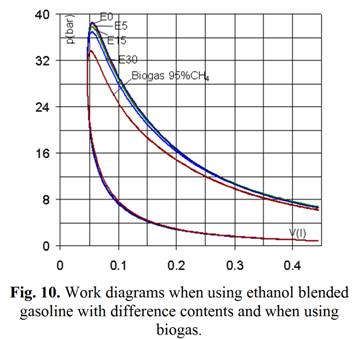
Figure 10 compares the work diagrams of the motor fueled by gasoline, ethanol blended gasoline with different concentrations and biogas at 3000 rpm. It can be seen that with the same advance angle ignition the indicated cycle work in case of ethanol blended gasoline decreases slightly in comparison to case of gasoline. Specifically, when fueled by traditional gasoline, E5, E15, E30, the indicated cycle works are 511 J /cycle, 510 J /cycle, 506 J/cycle and 493 J /cycle, respectively. Simulationresults also showed that when powered by biogas containing 95% and 100% CH4indicatedcyclework is only425J/cycle and 426J/cycle. Thus the indicated cyclework decreases by 17% when switching from petrol to biogas with CH4 concentrations greater than 95%. It means that when running on E5 and E15, engine power is almost unchanged in comparision to running on gasoline. In case of E30, indicated cycle workdecreasesby 3% in comparision to when running on gasoline and this reduction can be overcome by adjust the ignition angle appropriately.
4. Analysis of emission pollutants
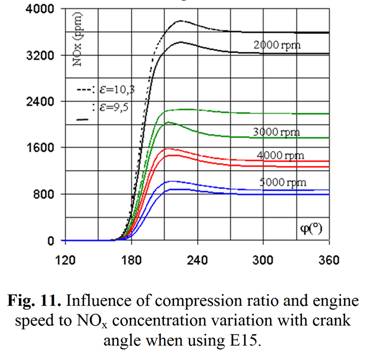
Figure 11 introduces the variations ofNOx concentrationin combustion chamber withthe enginecrankshaft rotation, corresponding tocompression ratio 9.5 and 10.3 and engine speed range from 2000 rpmto 5000 rpm.It can be seen thatNOxconcentration reaches a maximum value athigh temperature, then gradually decreases and maintainstability tothe end of the expansion.
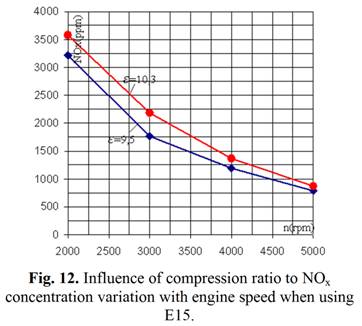
This stable concentrations are considered as the concentration of NOx in engine exhaust. At a given engine speed, when the compression ratio increased from 9.5 to 10.3, the NOx concentration increased by 7%. This can be explained by the increasing of solvent temperature which accelerates the formation speed of NOx. As engine speed increases, the concentration of NOx fell sharply (Figure 12). NOx concentration in the exhaust gas decreases to 78.5% when the engine speed increases from 2000 rpmto 5000 rpm. The reason is that when the engine speed increases leading to the increasing of turbulent movement and burns the roots forming NOx.
Variations of CO concentrations withcrankshaft angle, is similar to NOx variation but steep sharply at high temperature areas (Figure 13). Increasingcompression ratio slightly increasesCO concentration in the exhaust gas.When the compression ratio increasesfrom 9.5 to 10.3, the concentration of CO in the exhaust gas increases only 1%.
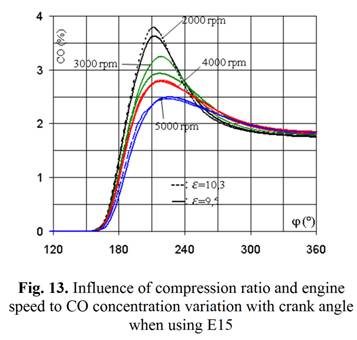
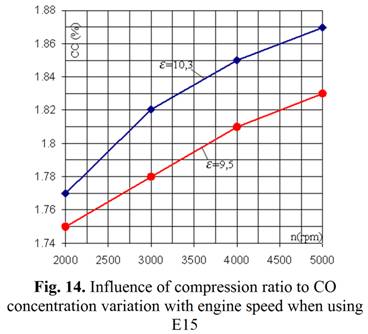
Although there are significant differences in the concentrationof CO in the maximumarea,at the end of the expansion the level of difference of CO concentration is not large and the effect of compression ratio to concentrationof CO in emissions is negligible. As the engine speed increases from 2000 rpmto 5000 rpmconcentrations of CO in exhaust gas increased by 5% (Figure 14).
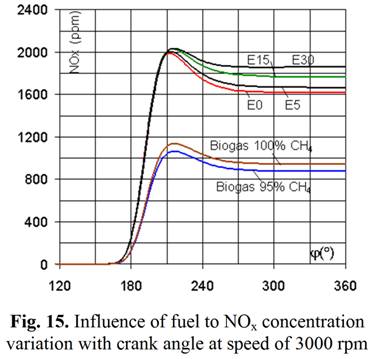
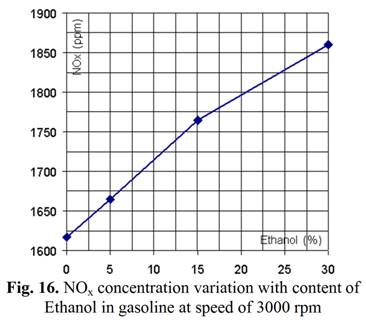
Influencesof fuel to the NOx concentration variation in the engine combustion chamber isintroduced in Figure 15. The simulation results are calculated with compression ratio of 9.5 and atspeed of3000 rpm. NOx concentration in the exhaust gas increases with content of ethanol blended with gasoline. When fueled by E5and E30,the concentration of NOx increase50 ppm(3%)and 250 ppm (15%) respectively, in comparison to the case of running on traditional gasoline(Figure 16).Meanwhile, in comparison with the gasoline, when powered by biogas containing 95% and 100% CH4, NOx concentration reduces to43% and 41%, respectively.
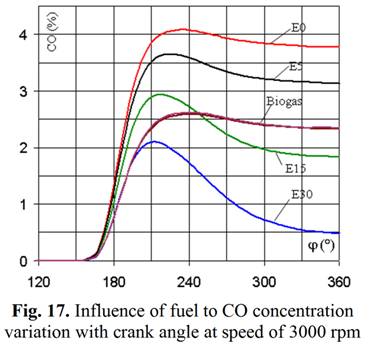
Unlike NOx, CO concentration decreases with increasing content of ethanol in petrol. Figure 17 introduced CO concentrationsvariation withcrank angle in case ofrunning on biogas and ethanol-blended gasoline atthe different components.
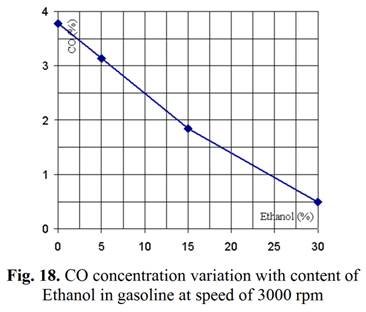
It can be seen that when content of ethanol increases, theconcentration of CO in the exhaust gas rapidly decrease. CO concentration reduction,compared to traditional gasoline,whenfueled byE5, E15 and E30 are 17%, 51% and 87%, respectively (Figure 18).Calculation results also showed that when content of CH4 in the biogas increases from 95% to 100% concentration of CO in the exhaust gas does not significantly change. Concentration of CO when running on biogas decreases 39% in comparison to running on gasoline and equivalent to running on E15.
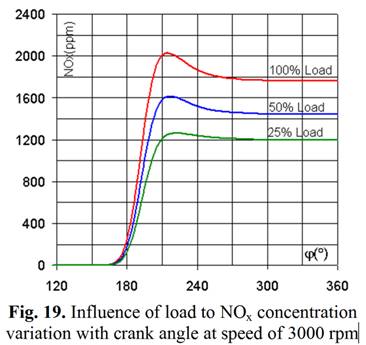
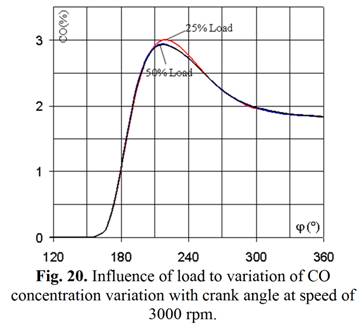
Load also significantly affect concentrations of NOx in the exhaust gas. When the engine load is reduced,NOx emissions also decreased (Figure 19). This can be explained by the temperature of the mixture dropped reducing NOx creationspeed. Meanwhile the load changes almost does not affect level of CO emissions (Figure 20).
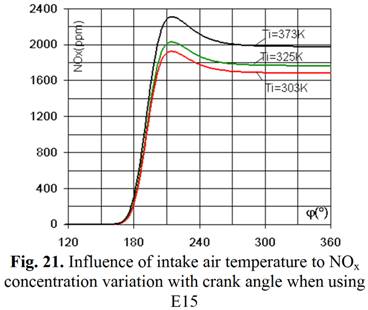
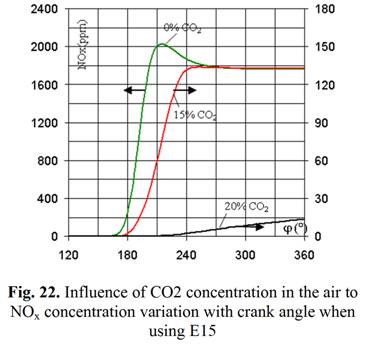
Intake air temperature slightly affected the level of NOx emissions. Figure 21 introduction of NOx variation with crank angle when engine is fueled by E15, compression ratio of 9.5 with intake air temperature is assumed 303K, 352K and 373K. It can be seen thatan increasingintake air temperature causes increasing of NOxconcentration in combustion products. This can be explained by the temperature of the combustion mixture increases with temperature intake air.These results indicate that NOx concentration depends on the temperature of the mixture. To reduce NOx concentrations, especially when the engine is running at low load, the modern engine is equipped with exhaust gas recirculation systems. After mixing the new intake air and exhaust gases (mainly CO2), the temperature of the combustion mixture decrease leads to lower levels of NOx in the exhaust gas.
5. Conclusion
The above research results allow us to draw the following conclusions:
1. When engine is fueled by E15 with compression ratio increasing from 9.5 to 10.3, indicated cycle workincreases by 2.4% at 2000 rpmand by 5.3% at 5000 rpm. Conversely the motor indicated cycle workdecreasesby 20% when the engine speed increases from 2000 rpmto 5000 rpm.
2. Without adjust the ignition angle, in case of using ethanol blended gasoline with ethanol content below 15%, the indicated cycle workis equivalent to the case of using traditional gasoline. When ethanolcontent increased to 30%, the indicated cycle workdecreased by 3% compared to the case of using traditional gasoline.When powered by biogas containingmore than95% CH4 the indicated cycle workdecreased by 17% compared to when running on traditional gasoline.
3. Ata given engine speed, when compression ratio increasesfrom 9.5 to 10.3, the NOx concentration increasesby 7% and concentration of CO increases 1%. When engine speed increases from 2000 rpmto 5000 rpm, the concentration of NOx in exhaust gas decreasesby 78.5% while the concentration of CO increasesby 5%.
4. Whenrunning onE5 and E30 , the NOx concentration in the exhaust gas increasesby3% and 15%, respectively,and CO concentration reducesby17% and 87%, respectively,compared to when running on gasoline. Meanwhile fueledby biogascontaining 95% CH4, NOx concentrations decreasesby43% and concentrations of CO reduction 39%in comparison to case ofrunning on traditional gasoline.
5. When reducing the engine load, the concentration of NOx in exhaust gas decreasesbut CO concentration almost less varies with load. The concentration of NOx in the exhaust gas increase slightly with the temperatureof intake air, but decreases dramatically with content of emissiongas recirculatedinto the manifold..
References
[1]. Huseyin Serdar Yucesu, Tolga Topgul, Can Cinat, Melih Okur: Effect of ethanol–gasoline blends on engine performance and exhaust emissions in different compression ratios. Applied Thermal Engineering, Volume 26, Issues 17-18, December 2006, Pages 2272–2278
[2]. Mustafa Koc, Yakup Sekmen, Tolga Topgül, Hüseyin Serdar Yücesu: The effects of ethanol–unleaded gasoline blends on engine performance and exhaust emissions in a spark-ignition engine. Renewable Energy, Volume 34, Issue 10, October 2009, Pages 2101–2106
[3]. Richie Daniel, Guohong Tian, Hongming Xu, Shijin Shuai: Ignition timing sensivities of oxygenated biofuels compared to gasoline in direct-injection SI engine. Fuel 99 (2012), pp. 72-82
[4]. S. Phuangwongtrakul, K.Wannatong, T. Laungnarutai and W. Wechsatol: Suitable Ignition Timing and Fuel Injection Duration for Ethanol-Gasoline Blended Fuels in a Spark Ignition Internal Combustion Engine. Proc. of the Intl. Conf. on Future Trends in Structural, Civil, Environmental and Mechanical Engineering, FTSCEM 2013, ISBN: 978-981-07-7021-1, pp. 39-42
[5]. Bui Van Ga, Nguyen Viet Hai, Nguyen Van Anh, Vo Anh Vu, Bui Van Hung: in cylinder pressure analysis in biogas-diesel dual fuel engine by simulation and experiment. UD’s Journal of Science and Technology, Vol.01(86), 2015, pp.24-29
[6]. Bui Van Ga, Tran Van Nam, Tran Thanh Hai Tung: A Simulation of Effects of Compression Ratios on the Combustion in Engines Fueled With Biogas with Variable CO2 Concentrations. Journal of Engineering Research and Application www.ijera.com Vol. 3, Issue 5, Sep-Oct 2013, pp.516-523 (IF: 1,69).


